Graphic organizers are an important tool to use in every content area. Graphic organizers are visual aids that help students see connections and relationships among main ideas, facts, and concepts. They guide students' thinking and communication. Graphic organizers can be formatted several different ways and if used correctly, can spice up any lesson
Examples:
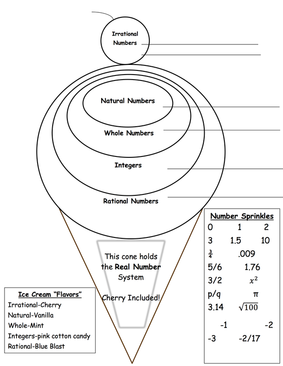
- Themed Graphic Organizer: Using a themed graphic organizer will help students commit to memory different concepts and how they relate to one another.
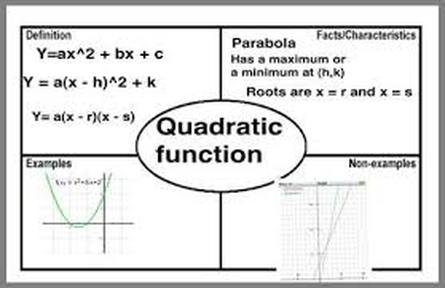
- Semantic Map: This type of graphic organizer is created by depicting the relationships between different concepts and ideas using bubbles and lines.
- Mind Map: A mind map is similar to a semantic map, however more detail is typically given.
- Matrices: Matrices are simple grids in which students can fill in the cross sections. One example would be a multiplication chart.
- Tree Diagram: This type of graphic organizer systematically breaks down and maps out in detail all components or elements of a concept. Mathematicians use these often in the form of factor trees.
|
|
